DataFrame Creation and Display
written by Zeyu Yan, Ph.D., Head of Data Science from Nvicta AI
Data Science in Drilling is a multi-episode series written by the technical team members in Nvicta AI. Nvicta AI is a startup company who helps drilling service companies increase their value offering by providing them with advanced AI and automation technologies and services. The goal of this Data Science in Drilling series is to provide both data engineers and drilling engineers an insight of the state-of-art techniques combining both drilling engineering and data science.
Our journey in Spark continues. Let's get started!
As always, the first step is to import the necessary dependencies and create a Spark Session:
from pyspark.sql import SparkSession
from datetime import datetime, date
import pandas as pd
from pyspark.sql import Row

spark = SparkSession.builder.getOrCreate()
DataFrame Creation
First let's talk about how to create a PySpark DataFrame from scratch, not by loading data stored in files. The first way is to create a DataFrame from a list of rows:
df = spark.createDataFrame([
    Row(a=1, b=2., c='string1', d=date(2000, 1, 1), e=datetime(2000, 1, 1, 12, 0)),
    Row(a=2, b=3., c='string2', d=date(2000, 2, 1), e=datetime(2000, 1, 2, 12, 0)),
    Row(a=4, b=5., c='string3', d=date(2000, 3, 1), e=datetime(2000, 1, 3, 12, 0))
])
df
The result is:
DataFrame[a: bigint, b: double, c: string, d: date, e: timestamp]Spark is smart enough to infer the data types. Let's take a look at the DataFrame created:
df.show()The result is:

We can also create the DataFrame with an explicit schema:
df = spark.createDataFrame([
    (1, 2., 'string1', date(2000, 1, 1), datetime(2000, 1, 1, 12, 0)),
    (2, 3., 'string2', date(2000, 2, 1), datetime(2000, 1, 2, 12, 0)),
    (3, 4., 'string3', date(2000, 3, 1), datetime(2000, 1, 3, 12, 0))
], schema='a long, b double, c string, d date, e timestamp')
df
In this case, we provide an explicit schema as a string. The result is:
DataFrame[a: bigint, b: double, c: string, d: date, e: timestamp]A more formal way of providing explicit schema to the DataFrame is through StrucType, which will be covered later in this series.
We can also create a PySpark DataFrame from a Pandas DataFrame. Let's first create a Pandas DataFrame:
pandas_df = pd.DataFrame({
    'a': [1, 2, 3],
    'b': [2., 3., 4.],
    'c': ['string1', 'string2', 'string3'],
    'd': [date(2000, 1, 1), date(2000, 2, 1), date(2000, 3, 1)],
    'e': [datetime(2000, 1, 1, 12, 0), datetime(2000, 1, 2, 12, 0), datetime(2000, 1, 3, 12, 0)]
})
pandas_df
The resulted Pandas DataFrame is:
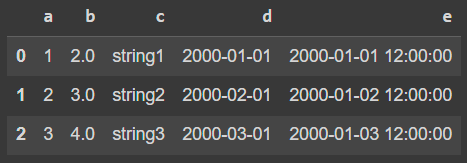
Now let's create a PySpark DataFrame from this Pandas DataFrame:
df = spark.createDataFrame(pandas_df)
df
The result is:
DataFrame[a: bigint, b: double, c: string, d: date, e: timestamp]Show the PySpark DataFrame:
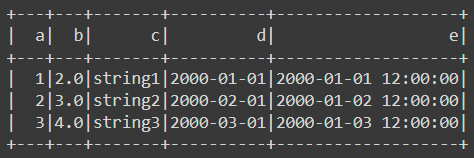
df.show()The result is:
The last way we will introduce is to create PySpark DataFrame from Spark RDDs. If you don't know what are RDDs in Spark, don't worry, we will cover RDD in details later in this series. This is how we create PySpark DataFrame from Spark RDDs:
rdd = spark.sparkContext.parallelize([
    (1, 2., 'string1', date(2000, 1, 1), datetime(2000, 1, 1, 12, 0)),
    (2, 3., 'string2', date(2000, 2, 1), datetime(2000, 1, 2, 12, 0)),
    (3, 4., 'string3', date(2000, 3, 1), datetime(2000, 1, 3, 12, 0))
])
df = spark.createDataFrame(rdd, schema=['a', 'b', 'c', 'd', 'e'])
df
The result is:
DataFrame[a: bigint, b: double, c: string, d: date, e: timestamp]Display Info of the DataFrame
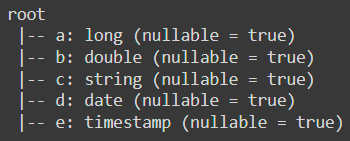
Let's show the schema of the previous DataFrame created from RDDs:
df.printSchema()The result is:
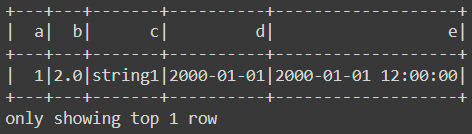
Now say we only want to display the first row of the DataFrame:
df.show(1)The result is:
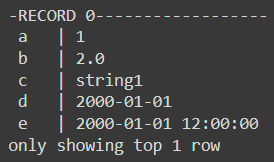
Now say we want to display the first row in a vertical manner:
df.show(1, vertical=True)The result is:
Show the column names of the DataFrame:
df.columnsThe result is:
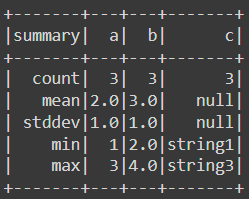
['a', 'b', 'c', 'd', 'e']Now we want to get some insightful information of columns a, b and c. The can be realized by:
df.select('a', 'b', 'c').describe().show()Or:
df.select(['a', 'b', 'c']).describe().show()Both of them generate the same result:
DataFrame.collect() collects the distributed data to the driver side as the local data in Python. Note that this can throw an out-of-memory error when the dataset is too large to fit in the driver side because it collects all the data from executors to the driver side.
df.collect()The result is:
[Row(a=1, b=2.0, c='string1', d=datetime.date(2000, 1, 1), e=datetime.datetime(2000, 1, 1, 12, 0)),
Row(a=2, b=3.0, c='string2', d=datetime.date(2000, 2, 1), e=datetime.datetime(2000, 1, 2, 12, 0)),
Row(a=3, b=4.0, c='string3', d=datetime.date(2000, 3, 1), e=datetime.datetime(2000, 1, 3, 12, 0))]
In order to avoid throwing an out-of-memory exception, use DataFrame.take() or DataFrame.tail().
df.take(1)The result is:
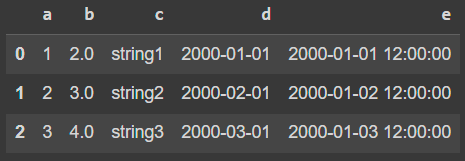
[Row(a=1, b=2.0, c='string1', d=datetime.date(2000, 1, 1), e=datetime.datetime(2000, 1, 1, 12, 0))]PySpark DataFrame also provides the conversion back to a pandas DataFrame to leverage pandas API. Note that toPandas also collects all data into the driver side that can easily cause an out-of-memory-error when the data is too large to fit into the driver side.
df.toPandas()The result is:
Conclusions
In this article, we covered DataFrame creation and display in PySpark. We will cover great details about Spark in this upcoming Spark tutorial series. Stay tuned!
Get in Touch
Thank you for reading! Please let us know if you like this series or if you have critiques. If this series was helpful to you, please follow us and share this series to your friends.
If you or your company needs any help on projects related to drilling automation and optimization, AI, and data science, please get in touch with us Nvicta AI. We are here to help. Cheers!
コメント