
Functions, Order By and Datetime in PySpark DataFrames
written by Zeyu Yan, Ph.D., Head of Data Science from Nvicta AI
Data Science in Drilling is a multi-episode series written by the technical team members in Nvicta AI. Nvicta AI is a startup company who helps drilling service companies increase their value offering by providing them with advanced AI and automation technologies and services. The goal of this Data Science in Drilling series is to provide both data engineers and drilling engineers an insight of the state-of-art techniques combining both drilling engineering and data science.
In the previous episode, we covered data filtering and aggregation in PySpark DataFrames. In this episode, we will continue to cover basic PySpark DataFrame operations. Let's start!
We have already covered how to set up PySpark development environment in Google Colab in the previous espisodes, therefore the details won't be covered again in this episode. Let's first create a Spark Session and load the data from a .csv file into a PySpark DataFrame:
!pip install pyspark py4j
from pyspark.sql import SparkSession
spark = SparkSession.builder.appName("groupbyagg").getOrCreate()
data_path = '/content/drive/MyDrive/test_data/sales_info.csv'
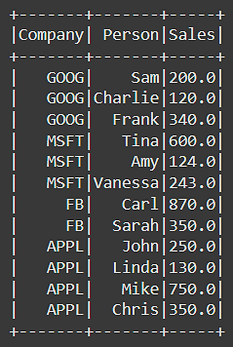
df = spark.read.csv(data_path, inferSchema=True, header=True)
df.show()The DataFrame looks as follows:
Functions
Let's first take a look at some of the builtin functions in PySpark. Import the necessary dependencies:
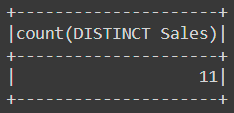
from pyspark.sql.functions import countDistinct, avg, stddev, format_numberSay we want to count the distinct values in the Sales column, the countDistinct function can be used:
df.select(countDistinct('Sales')).show()The result is:
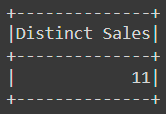
The .alias method can be used to change the name of the resulted column:
df.select(countDistinct('Sales').alias('Distinct Sales')).show()The result is:
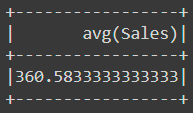
Say we want to find the average value of the Sales column, the avg function can be used:
df.select(avg('Sales')).show()The result is:
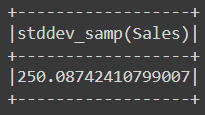
We can also use the stddev function to find the standard deviation of the Sales column:
df.select(stddev('Sales')).show()The result is:
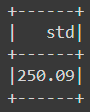
The result doesn't look so nice. We can further rename the column and round the result to 2 decimals:
sales_std = df.select(stddev("Sales").alias('std'))
sales_std.select(format_number('std', 2).alias('std')).show()
The new result is:
Order By
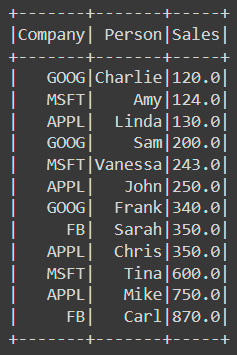
The .orderBy function from PySpark DataFrame can be used to order the DataFrame based on some specific condtions. Say we want to order the DataFrame by the Sales column in an ascending order:
df.orderBy('Sales').show()The result is:
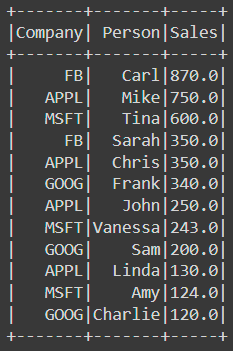
We can also order the DataFrame by the Sales column in a descending order:
df.orderBy(df['Sales'].desc()).show()The result is:
Datetime
Now let's talk about how to manipulate datetime in PySpark. First load the necessary dependencies and a new DataFrame:
from pyspark.sql.functions import format_number, dayofmonth, dayofyear, month, year, weekofyear, date_format
data_path = '/content/drive/MyDrive/test_data/appl_stock.csv'
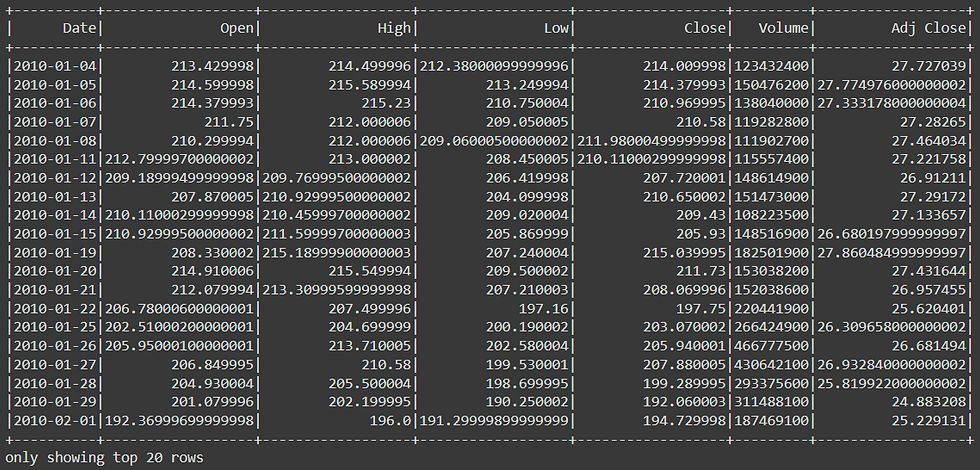
df = spark.read.csv(data_path, inferSchema=True, header=True)
df.show()The DataFrame looks as follows:
We can get the day of month from the Date column as follows:
df.select(dayofmonth(df['Date'])).show()The result is:

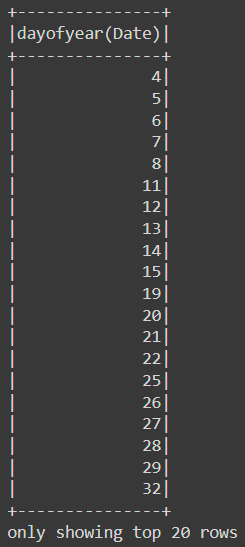
We can get the day of year from the Date column as follows:
df.select(dayofyear(df['Date'])).show()The result is:
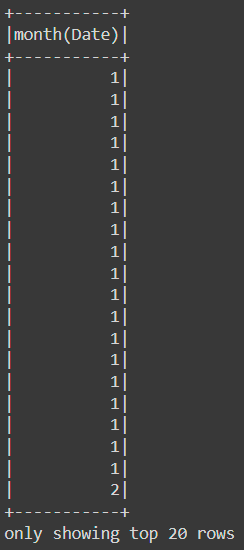
We can get the month from the Date column as follows:
df.select(month(df['Date'])).show()The result is:
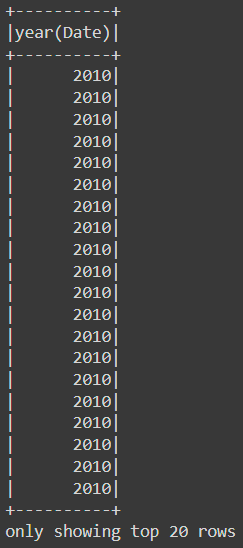
We can get the year from the Date column as follows:
df.select(year(df['Date'])).show()The result is:
To create an extra column in the DataFrame with the year of the Date column:
df.withColumn('Year', year(df['Date'])).show()The result is:

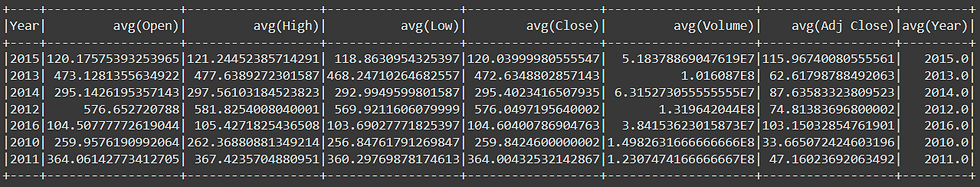
Calculate the average value of each numerical column for each year:
new_df = df.withColumn('Year', year(df['Date']))
new_df.groupBy('Year').mean().show()
The result is:
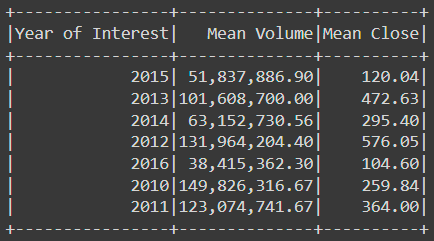
Finally, say we only care about the mean of the Volume and Close columns, and we also want some better names for the columns of the resulted DataFrame:
result = new_df.groupBy('Year').mean()[['Year', 'avg(Volume)', 'avg(Close)']]
result = result.withColumnRenamed('Year', 'Year of Interest')
result = result.select(['Year of Interest', format_number('avg(Volume)', 2).alias('Mean Volume'), format_number('avg(Close)', 2).alias('Mean Close')])
result.show()
The result is:
Conclusions
In this article, we covered functions, order by and datetime in PySpark DataFrames. We will cover great details about Spark in this upcoming Spark tutorial series. Stay tuned!
Get in Touch
Thank you for reading! Please let us know if you like this series or if you have critiques. If this series was helpful to you, please follow us and share this series to your friends.
If you or your company needs any help on projects related to drilling automation and optimization, AI, and data science, please get in touch with us Nvicta AI. We are here to help. Cheers!
Comentarios