Data Filtering and Aggregation in PySpark DataFrames
written by Zeyu Yan, Ph.D., Head of Data Science from Nvicta AI
Data Science in Drilling is a multi-episode series written by the technical team members in Nvicta AI. Nvicta AI is a startup company who helps drilling service companies increase their value offering by providing them with advanced AI and automation technologies and services. The goal of this Data Science in Drilling series is to provide both data engineers and drilling engineers an insight of the state-of-art techniques combining both drilling engineering and data science.
This blog post belongs to our Spark tutorial series and will introduce some bacic Pyspark DataFrame operations. Let's start!
We have talked about how to set up development environment using Google Cloab in the previous episode. The first thing to do is to import the necessary dependenceis and create an Spark Session:
from pyspark.sql import SparkSession
spark = SparkSession.builder.appName("App").getOrCreate()
This time we will create the PySpark DataFrame through loading a .csv file. The .csv file is in my Google Drive and I have already mounted it to the Colab notebook.
data_path = '/content/drive/MyDrive/test_data/appl_stock.csv'
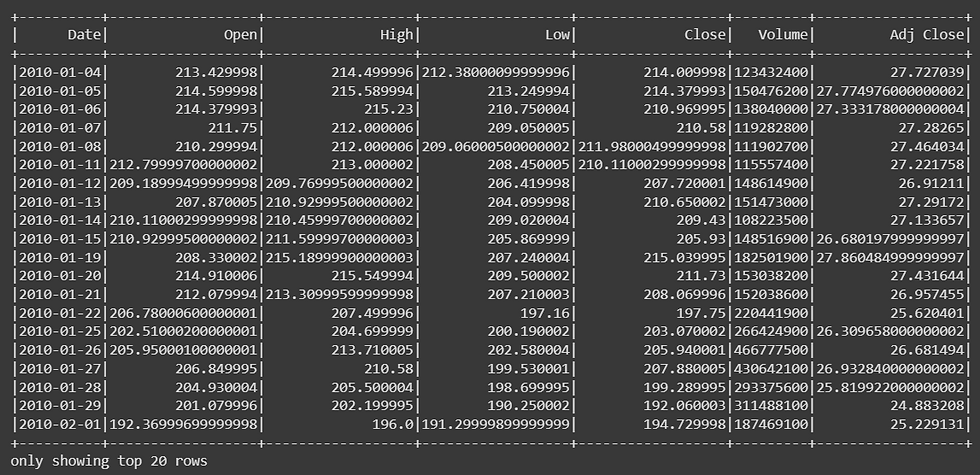
df = spark.read.csv(data_path, inferSchema=True, header=True)
df.show()The result is:
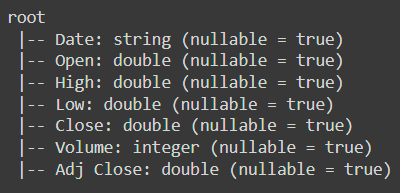
Let's take a look at the schema of this DataFrame:
df.printSchema()The result is:
Filtering Data
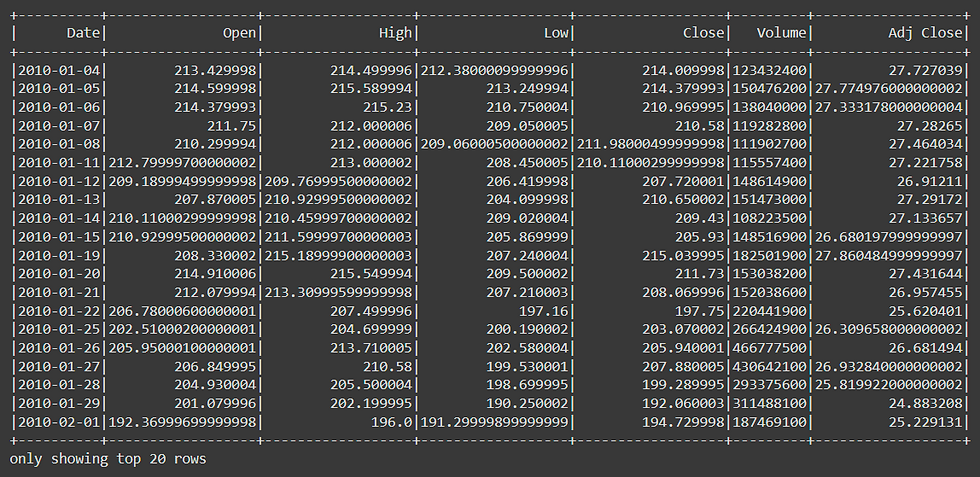
Let's first talk about data filtering. The first way to apply filtering is through SQL statements. Say we want to find all the rows with Close less than 500:
# Using SQL
df.filter('Close < 500').show()
The result is:
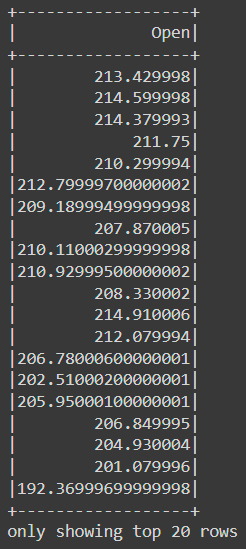
If we are only interested in the Open column:
df.filter('Close < 500').select('Open').show()The result is:
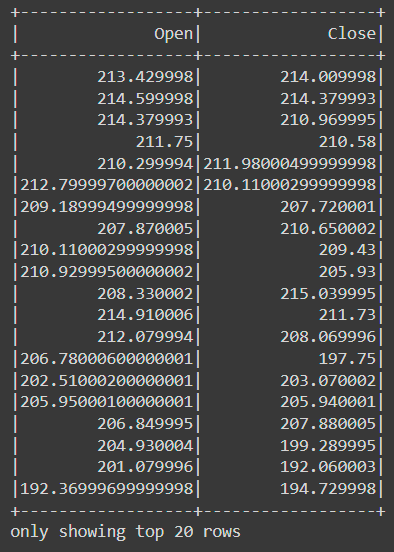
If we are interested in both the Open and the Close column:
df.filter('Close < 500').select(['Open', 'Close']).show()The result is:
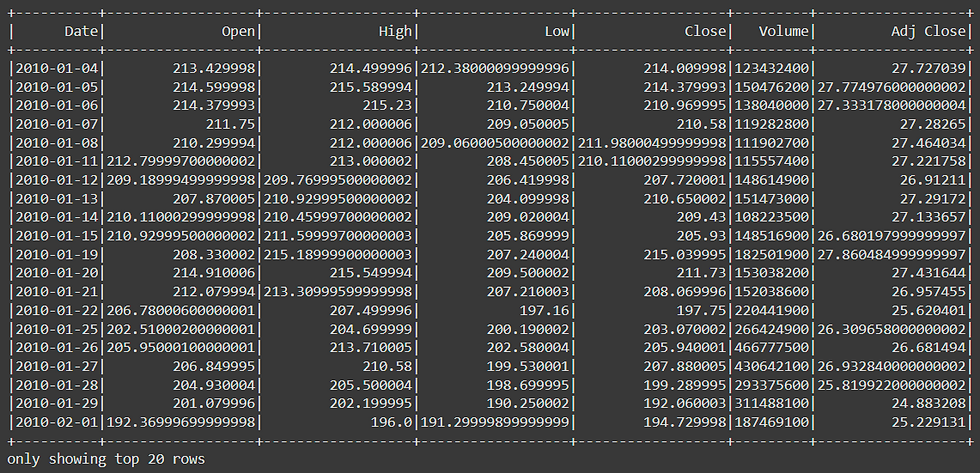
Another way of filtering is through DataFrame's columns. Find all the rows with Close less than 200:
df.filter(df['Close'] < 200).show()The result is:
Find all the rows with Close less than 200 and Open greater than 200:
df.filter((df['Close'] < 200) & (df['Open'] > 200)).show()The result is:

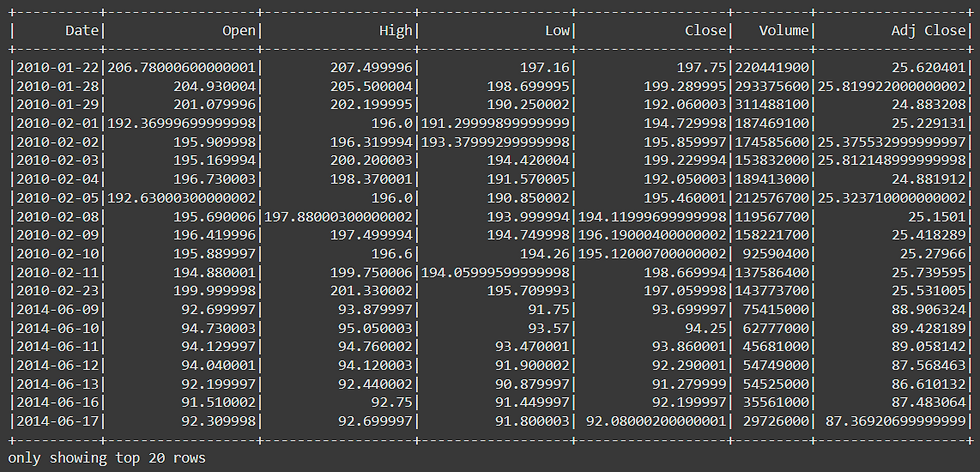
Find all the rows with Close less than 200 or Open greater than 200:
df.filter((df['Close'] < 200) | (df['Open'] > 200)).show()The result is:
Find all the rows with Close less than 200 and Open not less than 200:
df.filter((df['Close'] < 200) & ~(df['Open'] < 200)).show()The result is:
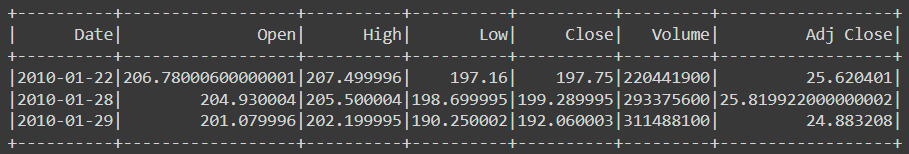
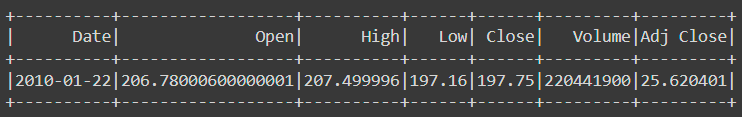
Find the rows with Low equals to 197.16:
df.filter(df['Low'] == 197.16).show()The result is:
We can collect the filtered data as a Python List of PySpark Row objects:
# Collecting results as Python objects
df.filter(df['Low'] == 197.16).collect()
The result is:

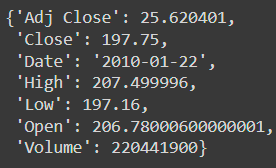
We can easily convert a PySpark Row into a Python Dict:
result = df.filter(df['Low'] == 197.16).collect()
row = result[0]
row.asDict()
The result is:
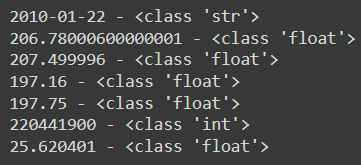
Or we can also iterate through a Row object:
for item in result[0]:
  print(f'{item} - {type(item)}')
The results are:
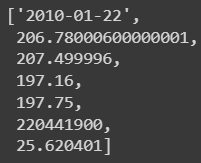
We can also convert a Row object into a Python List:
list(result[0])The result is:
Data Aggregation
Next, let's talk about data aggregation in Pyspark. Create a new DataFrame by loading a new .csv file:
data_path = '/content/drive/MyDrive/test_data/sales_info.csv'
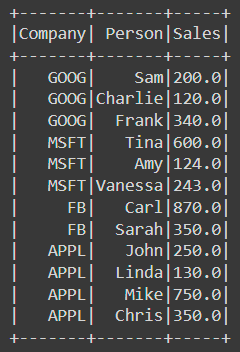
df = spark.read.csv(data_path, inferSchema=True, header=True)Take a look at the DataFrame:
df.show()The result is:
Take a look at the DataFrame's schema:
df.printSchema()The result is:

The data aggregation is very similar to SQL's groupby. First let's try to find the mean of the columns grouped by company:
# Mean
df.groupBy('Company').mean().show()
The result is:
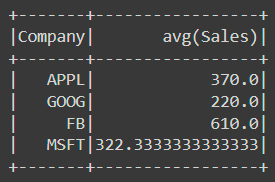
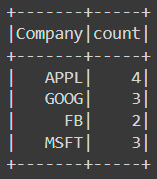
The person column doesn't have a mean. Then let's find the count of records by company:
# Count
df.groupBy('Company').count().show()
The result is:
The max, min and sum are all similar:
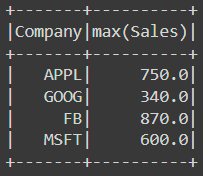
# Max
df.groupBy('Company').max().show()
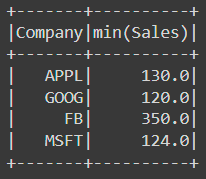
# Min
df.groupBy('Company').min().show()
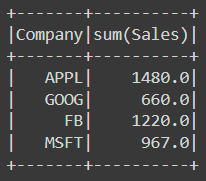
# Sum
df.groupBy('Company').sum().show()The results are:
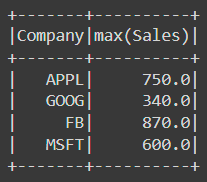
If we want to aggregate a specific column, we can do this as follows:
df.groupBy('Company').agg({'Sales': 'max'}).show()The result is:
Conclusions
In this article, we covered how to perform data filtering and aggregation for PySpark DataFrames. We will cover great details about Spark in this upcoming Spark tutorial series. Stay tuned!
Get in Touch
Thank you for reading! Please let us know if you like this series or if you have critiques. If this series was helpful to you, please follow us and share this series to your friends.
If you or your company needs any help on projects related to drilling automation and optimization, AI, and data science, please get in touch with us Nvicta AI. We are here to help. Cheers!
Comments